An e-commerce dashboard provides real-time insights for optimizing online performance.
An e-commerce (or e-com) dashboard is a centralized digital tool that provides a visual representation of key performance metrics and data relevant to an online store's operations and success. It typically includes various charts, graphs, and tables that display information such as sales revenue, order volume, website traffic, conversion rates, customer demographics, and inventory levels. E-commerce dashboards allow business owners and managers to quickly assess the health of their online store, identify trends, track progress towards goals, and make data-driven decisions to optimize performance and drive growth. They serve as a comprehensive monitoring and analytical tool, helping businesses navigate the complexities of the digital marketplace effectively.
An e-commerce dashboard is a user-friendly interface that visually presents essential metrics and data pertinent to an online store's performance and operations. It features charts, graphs, and tables showcasing information like sales revenue, order volume, customer demographics, and inventory levels. Through this dashboard, e-commerce business owners and managers efficiently evaluate their store's health, spot trends, track goal progress, and make informed decisions to enhance performance. Serving as a central hub for monitoring and analyzing various business aspects, the e-commerce dashboard plays a pivotal role in driving growth and success in the digital marketplace.
Period Selection
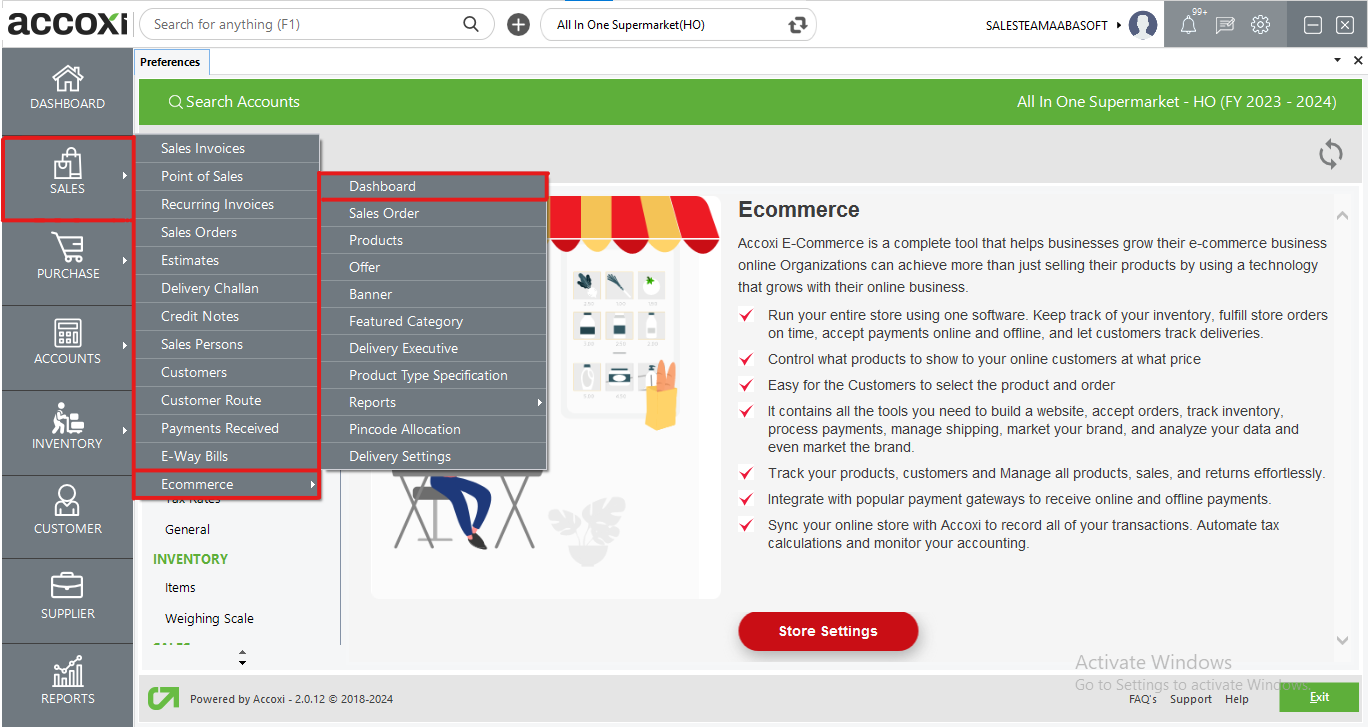
In an e-commerce dashboard, "period selection" refers to the ability to choose specific time frames or periods for viewing and analyzing data. This feature allows users to select predefined periods like today, 7 days, 14 days, 30 days, custom and lifetime. By selecting different periods, users can compare data over time, track trends, and gain insights into their online store's performance and fluctuations in metrics such as sales revenue, order volume, and product profiles. Period selection functionality enhances the dashboard's flexibility and usability, empowering users to make informed decisions and optimizations based on historical data and trends within their chosen time frames.
Other fields and graphs in dashboard
|
Field |
Description |
|
Sales |
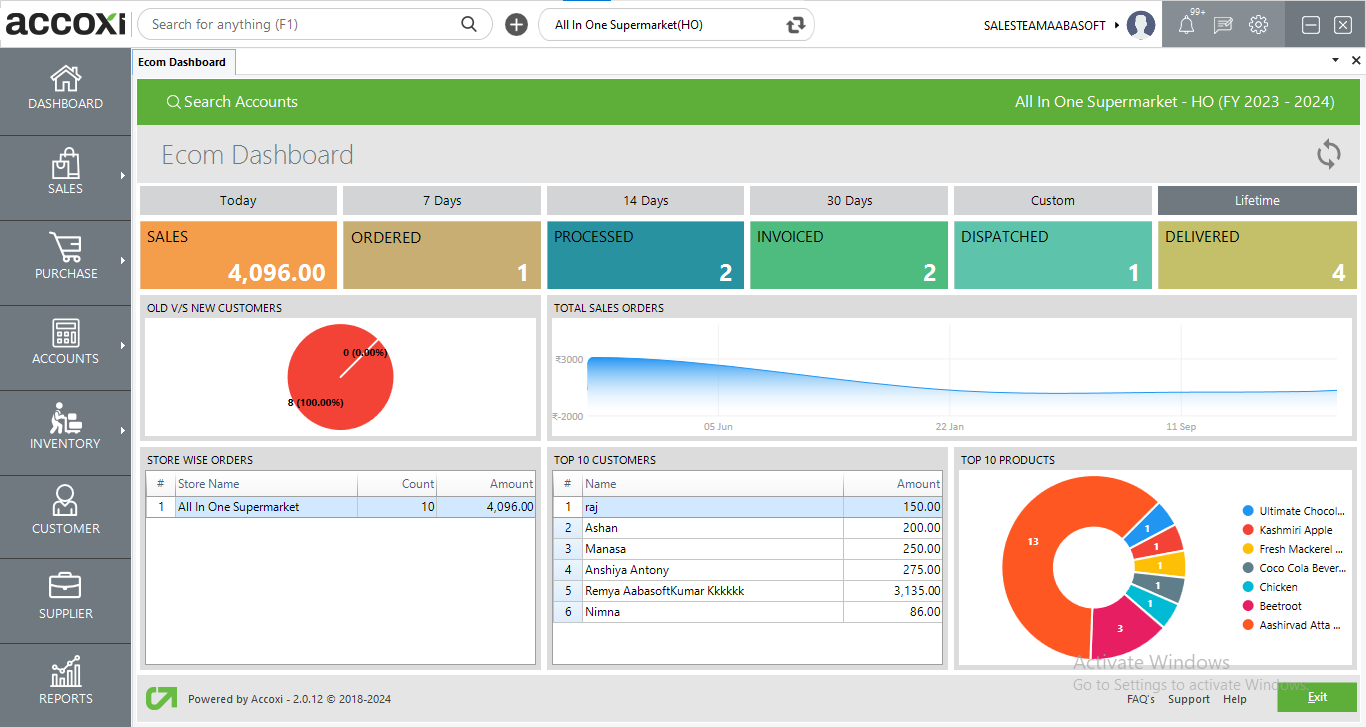
This field displays a representation of total sales made during the selected period, presented in terms of amount. |
|
Ordered |
This field indicates the number of orders that have been placed. When the status of an order is changed to "processed," the count in this field decreases. Conversely, when a customer places an order, the count increases. |
|
Processed |
The field displays the count of orders that have been processed. When the status is changed from "processed" to "invoiced," the count decreases. Conversely, when an order transitions from "order" to "processed," the count increases. |
|
Invoiced |
The field represents the count of orders that have been invoiced. When the status changes from "invoiced" to "dispatched," the count decreases. Conversely, when an order progresses from "processed" to "invoiced," the count increases. |
|
Dispatched |
This field indicates the count of orders that have been dispatched. When the status changes from "dispatched" to "delivered," the count decreases. Conversely, when an order progresses from "invoiced" to " dispatched," the count increases. |
|
Delivered |
This field displays the count of orders that have been delivered. When the status changes from "dispatched" to "delivered," the count increases. |
|
Old V/S New Customers |
The "Old vs. New Customers" pie chart visually compares sales from existing and new customers within a selected period, using distinct colors to represent each category. |
|
Total Sales Orders |
The graphical representation of total sales orders provides a visual depiction of the total amount of orders generated over a specific period. |
|
Store Wise Orders |
The "Store Wise Orders" section offers insights into the total count and amount of orders generated in each webstore. |
|
Top 10 Customers |
The "Top 10 Customers" section offers insights into the total amount of sales generated by the top 10 customers. |
|
Top 10 Products |
The "Top 10 Products" section presents insights into the most sold products through a pie chart. It includes details such as the product name, quantity sold, and a percentage representation. |