Organization Unit Dashboard in Accoxi

It shows monthly wise profit Center and cost Center analysis which helps the user for easy generation and analysis of Profit/cost.

OU Dashboard In ACCOXI

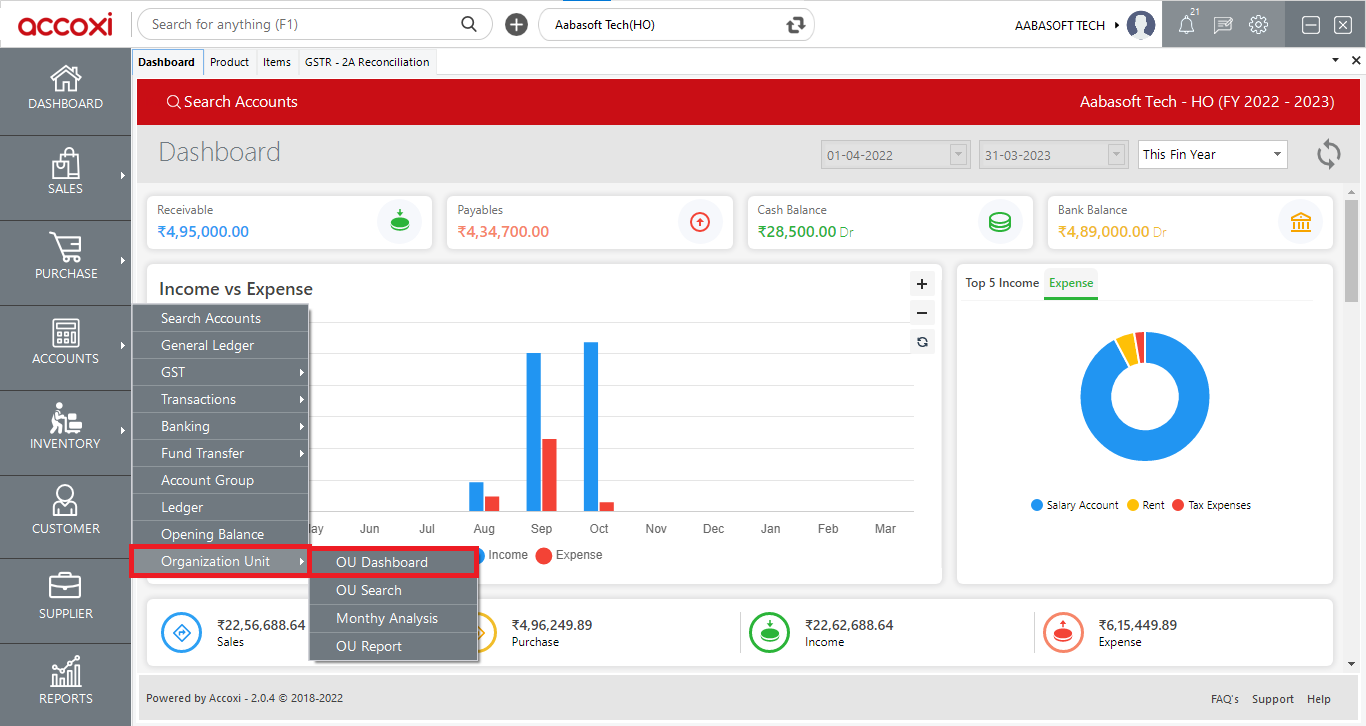
OU dashboard indicates an overview of an organization unit. It shows monthly wise profit Center and cost Center analysis which helps the user for easy generation and analysis of Profit/cost of their Organization Units. Mapped product profit is one of the important features of OU in ACCOXI. It facilitates users to know about their product-wise profit in an organizational unit.
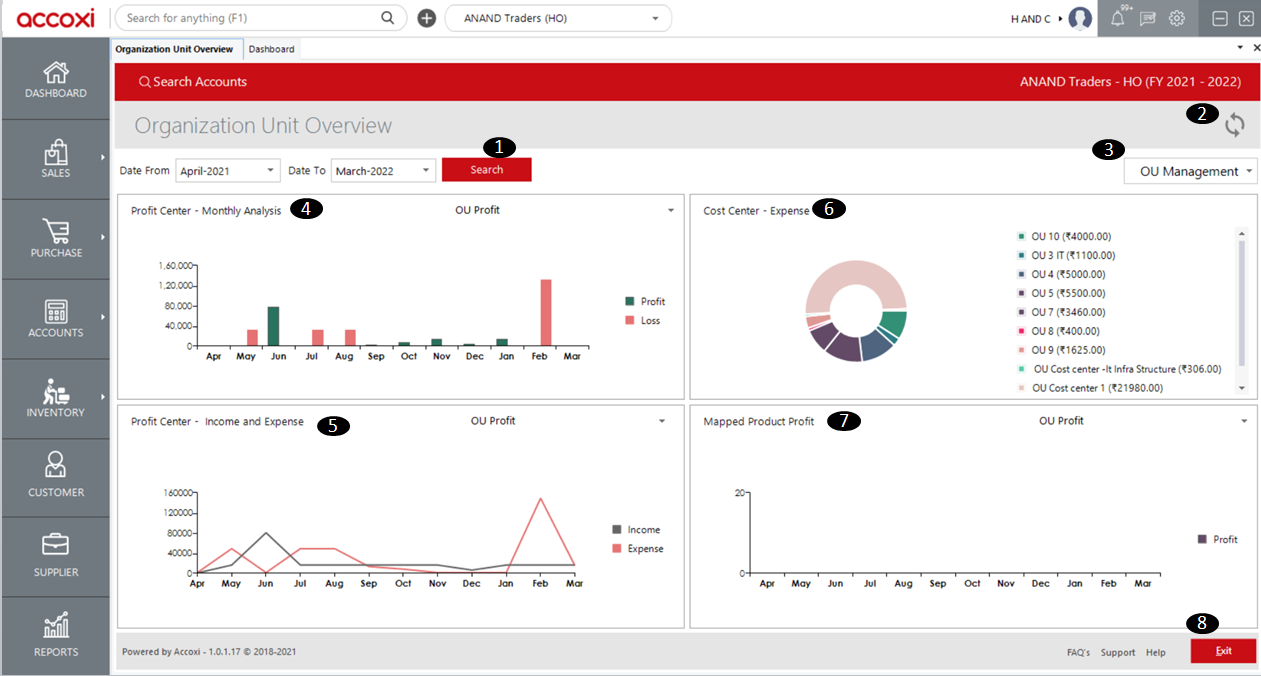
Organization Unit Dashboard

Key features

  • Monthly wise analysis of cost Center and profit Center data
  • If the user has a different organization unit he can easily switch to another OU by clicking on the drop-down list
  • Users can easily sort data by selecting From and To date in the search option
  • It makes comparisons easier
  • When the mouse pointer points on the chart then the user can see the value and month of the pointed data

OU Dashboard
  • Click on Accounts Section
  • Click organizational unit 
  • Select OU dashboard

Menu Available In Organizational Unit Overview

MENU AVAILABLE IN ORGANIZATIONAL UNIT

1. Search option

  • Users can search profit Center or cost Center information by setting the ‘Date From’ & ‘Date To’ options. Users can easily sort out information for a month or according to the user’s needs.


2. Refresh option

  • If The Latest Data Is Not Displayed, Click On The Refresh Icon On The Top Right Corner Of The Page To Fetch The New Data.


3. OU management

  • While clicking on the drop-down list user can choose either OU search, Monthly Analysis, or OU Report.


4. Profit Center- Monthly Analysis

  • The profit Center monthly analysis shows the monthly wise profit and displays it in a Bar Chart.
  • It is very clear to the user on which month they yield more profit, from which profit Center and the value of profit can be seen when mousing pointer points on the chart.


5. Profit Center- Income and Expense

  • It displays profit Center wise income and expense and shows it on a line chart.
  • The dark color indicates income and the light color indicates expenses.
  • Users can change from one profit Center to another by clicking on the drop-down list.


6. Cost Center- Expense

  • It displays the total expenses incurred in a particular cost Center
  • It displays data in the pie chart
  • On the right side, the user can see Cost Center wise total expenses incurred


7. Mapped Product Profit

  • It shows a stock-wise profit of a particular profit Center on a monthly basis.
  • Users can mark the items inside the ‘OU search Option’ and then select the item under ‘stock’.
  • It displays data on Bar Chart
  • Users can select another profit Center by clicking on the drop-down list


8. Exit Option

  • Users can exit from the current window and it will redirect to the previous page

Frequently Asked Questions?

01How can I switch from the monthly details of one profit Center to another profit Center?

  • Click on Accounts Section
  • Under Organization Unit select ‘OU Dashboard’
  • Click on the drop-down list that you can see near to ‘Profit Center – Monthly Analysis’
  • select the required Profit Center then it will show the monthly details of that selected profit Center

02What are the details available in OU Dashboard in ACCOXI?

  • The details available in OU Dashboard are monthly analysis of profit Center, a monthly analysis of income and expense, details of Cost Center Analysis, and monthly details of Mapped product profit

03How can I sort the details of the Organization Unit for a particular period?

  • Click on Accounts Section
  • Under Organization Unit select ‘OU Dashboard’
  • On the top left side of the screen user can see a ‘Date From’ and ‘Date To’ option, select the required period
  • Click on the Search option

Are you sure,
You want to log out ?